Asset Graph
The Asset Graph visualizes AWS assets and IAM permission relationships in a single graph.
Going beyond a simple asset list, it analyzes permission relationships, trust relationships, and policy connection structures (Edges) together,
so you can understand who has what permissions over which assets in your AWS environment.
1. Layout Overview
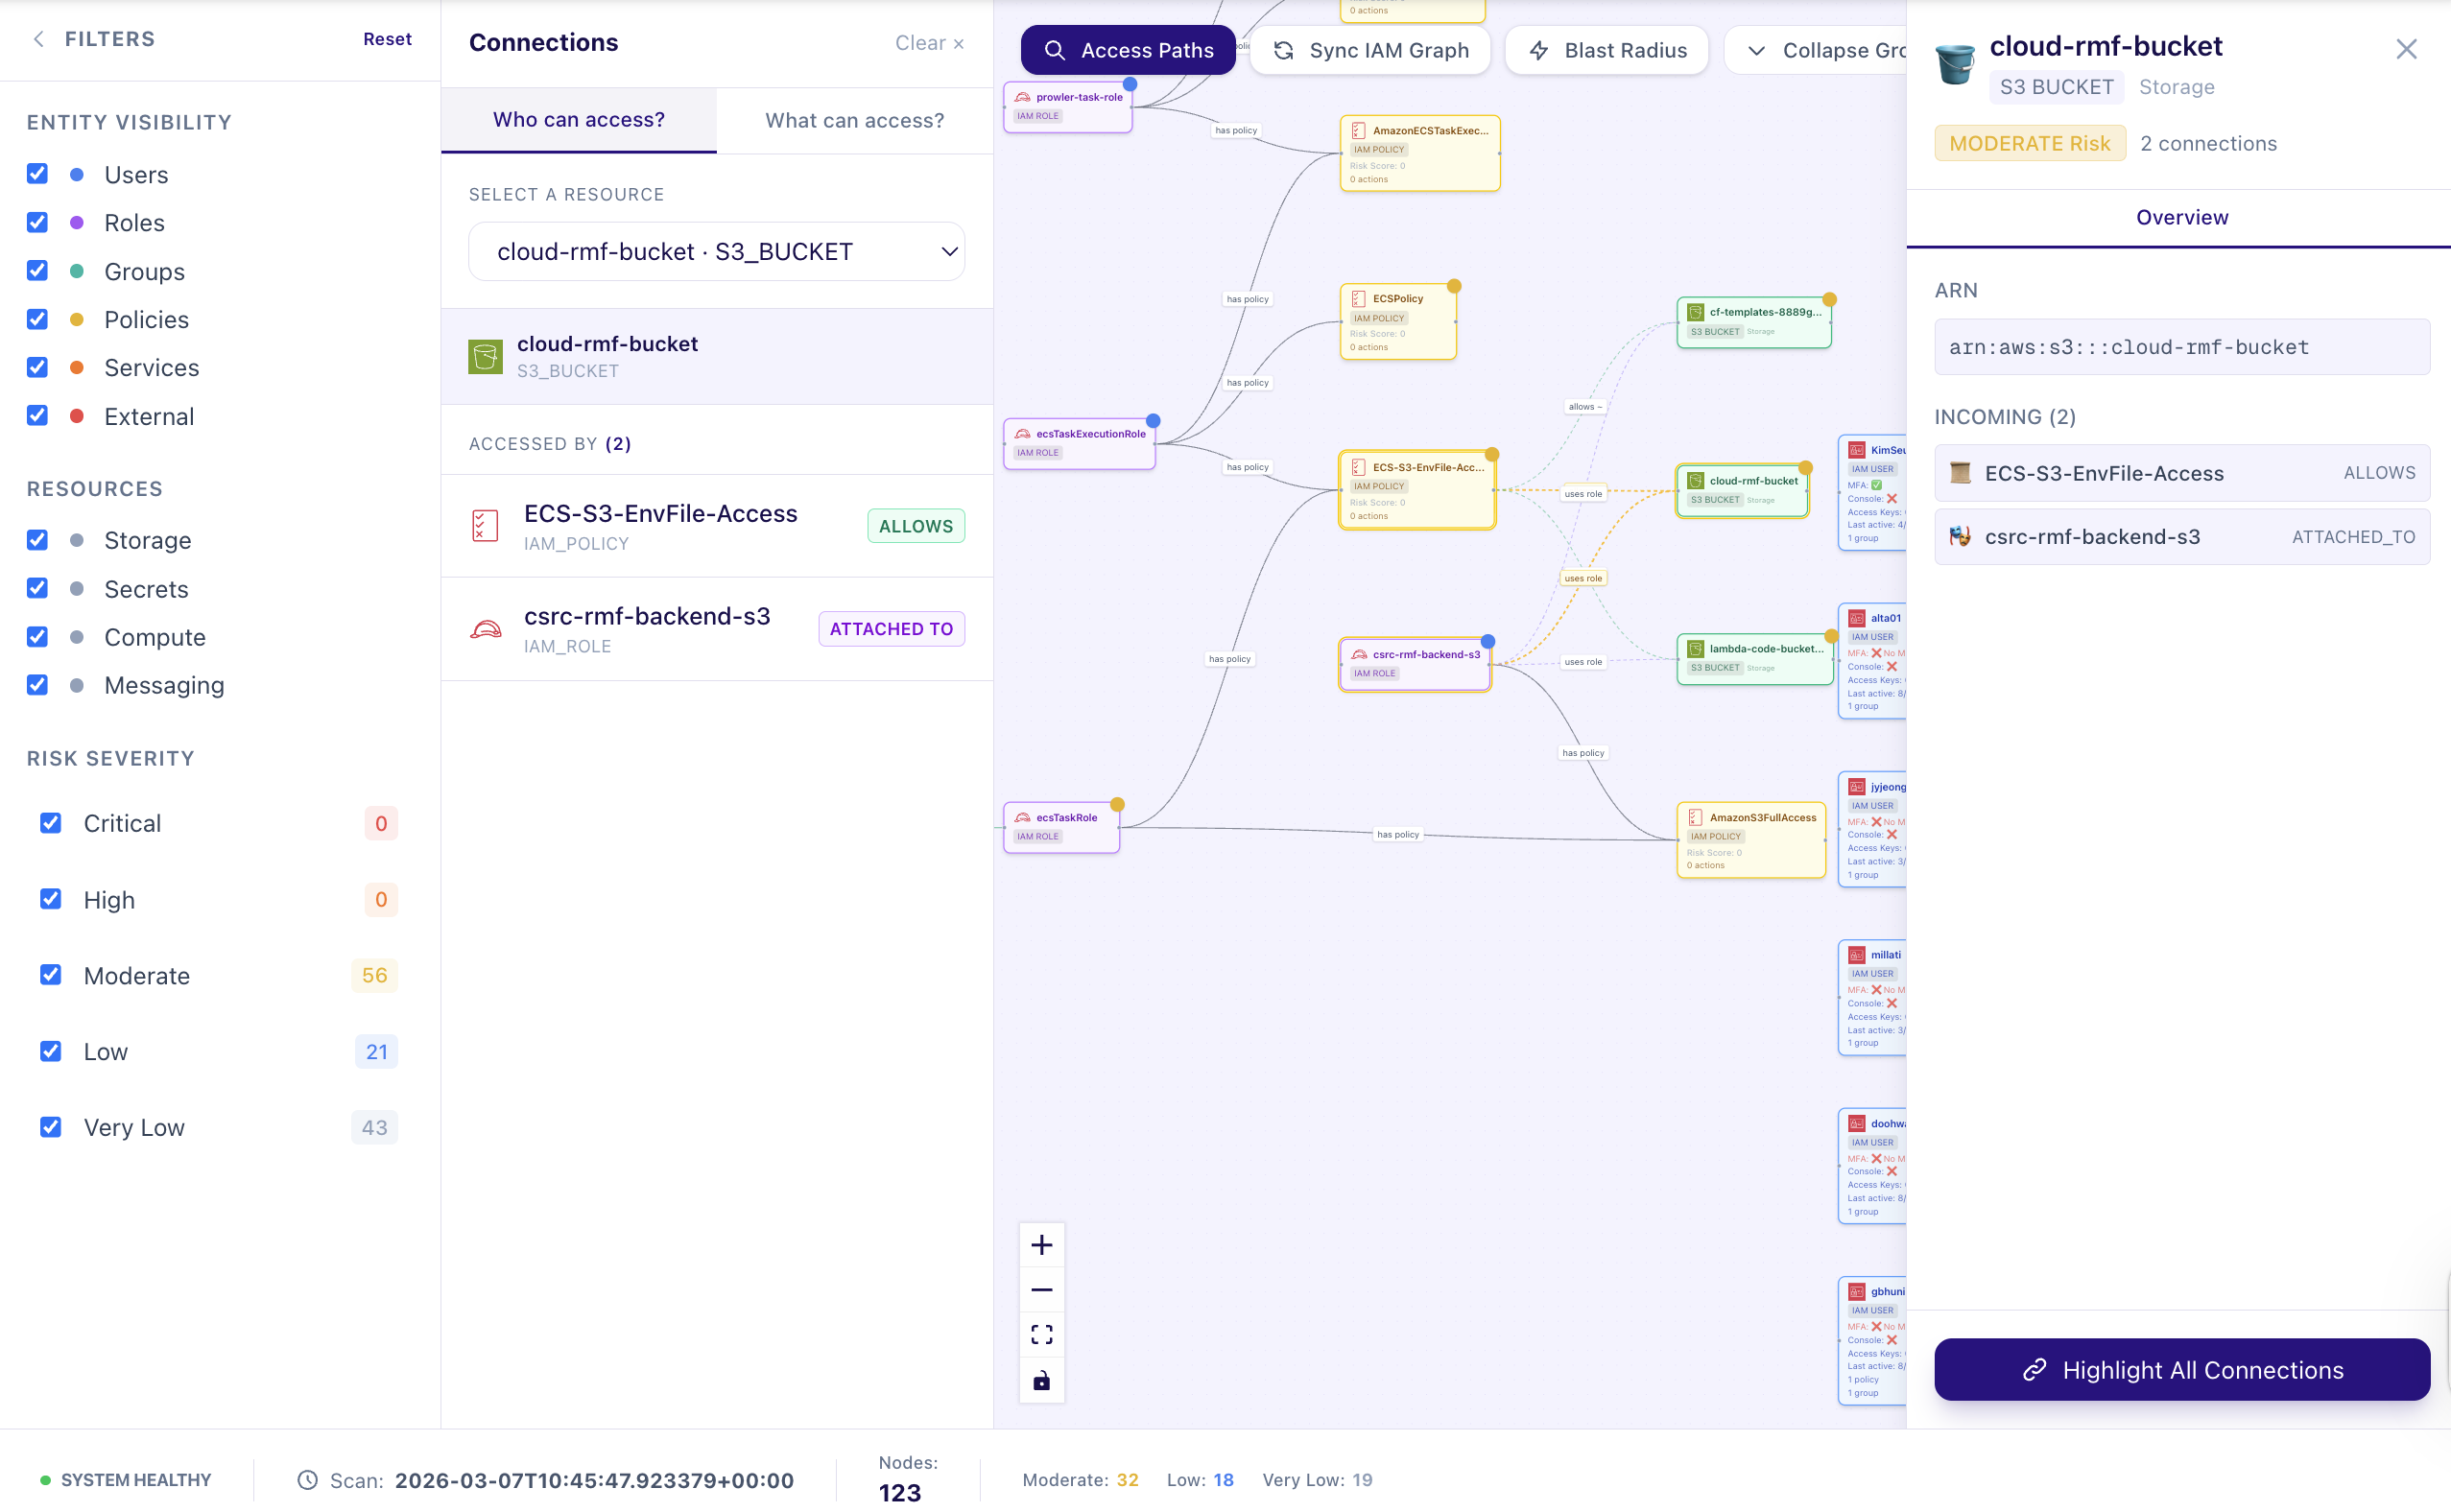
The Asset Graph screen is organized into the following sections:
1.1. Graph Area
AWS assets and IAM entities are displayed as nodes, with relationships between them visualized as edges.
The graph lets you see:
- IAM Role / User / Policy relationships
- Connection structures between AWS assets
- Permission flows and trust relationships
1.2. Filters & Controls
Adjust which assets are shown using the controls at the top of the graph.
- Search: Search by name or ARN
- Resource Type Filter: Filter by resource type — IAM / Compute / Storage, etc.
- Risk Level Filter: Filter based on permission risk level
- Sync button: Regenerate the graph based on the latest asset and IAM relationship data
1.3. Asset Detail Panel
Clicking a node in the graph opens the asset detail panel.
Available information:
- Basic asset info (Name, ARN, Resource Type)
- Attached policies and permissions
- Permission Insights analysis results
- Related assets and relationships
2. Graph Structure
The Asset Graph represents assets and permission relationships in graph form based on your AWS environment.
2.1. Nodes
Each node in the graph represents an AWS asset or IAM entity.
Main node types:
- IAM User
- IAM Role
- IAM Group
- IAM Policy
- AWS Resource (EC2, S3, RDS, etc.)
Nodes represent entities that hold permissions or are targets of permissions in the AWS environment.
2.2. Edges
Edges represent permission or trust relationships between assets.
Main relationship types:
| Edge | Meaning |
|---|---|
| TRUSTS | Trust relationship between Roles (Assume Role) |
| HAS_POLICY | An entity (User/Role/Group) owns a policy |
| ALLOWS | A policy allows specific AWS actions |
| MEMBER_OF | A User belongs to a Group |
| ATTACHED_TO | A policy is attached to an entity |
These relationships enable privilege flow analysis.
3. Graph Synchronization (Sync)
To generate the Asset Graph, you need to synchronize asset and IAM relationship data.
Synchronization Process
Running Sync performs the following two operations:
1️⃣ AWS Asset Synchronization
Scans the following resources:
- EC2
- Lambda
- S3
- RDS
- DynamoDB
- SQS / SNS
- Secrets Manager
- KMS
- IAM
This process collects asset metadata and baseline risk information.
2️⃣ IAM Relationship Synchronization
Analyzes IAM entities and policy documents to build the following relationships:
- Role / User / Group relationships
- Policy attachment structures
- Permission allow relationships
These two data sets are combined to generate the Asset Graph.
4. Permission Insights
Permission Insights analyzes IAM policies to calculate permission risk levels.
Analysis items:
- Total actions – Total number of actions allowed by the policy
- Unique services – Number of accessible AWS services
- Wildcard actions/resources – Whether
*permissions are used - Dangerous action detection
iam:*PassRoleCreateAccessKeyPutUserPolicy, etc.
- Admin privilege status
- Risk Score (0–100)
Analysis results are also included as properties of IAM Policy nodes, so you can view them directly in the graph.
5. How to Use the Asset Graph
The Asset Graph enables the following security analyses:
- Identify the IAM entities with the most powerful permissions
- Detect policies with wildcard (
*) permissions - Analyze the current state of admin privilege grants
- Identify cross-account access risks
- Check adherence to the Least Privilege principle
Graph-based analysis lets you understand permission structures and security risks at a glance.