Risk Assessment
Risk Assessment runs a security scanning engine against your synchronized AWS assets to identify risk factors for each asset.
The entire flow — initiating a scan, viewing history, reviewing a results summary, and drilling down into per-asset analysis — is available on a single page.
+ New Scan runs against the most recently synchronized assets.
The Risk Assessment page is organized into the following sections:
- Scan Control – Start a new scan and view the latest results summary
- Scan History – Records of previous scan runs
- Scan Results – Risk assessment results per asset
1. Running a Scan & Scan History
1.1. Running a New Scan
To run a risk assessment:
- Click the + New Scan button at the top.
- The scan starts against your most recently synchronized assets.
- Once complete, results appear in the Scan Results section.
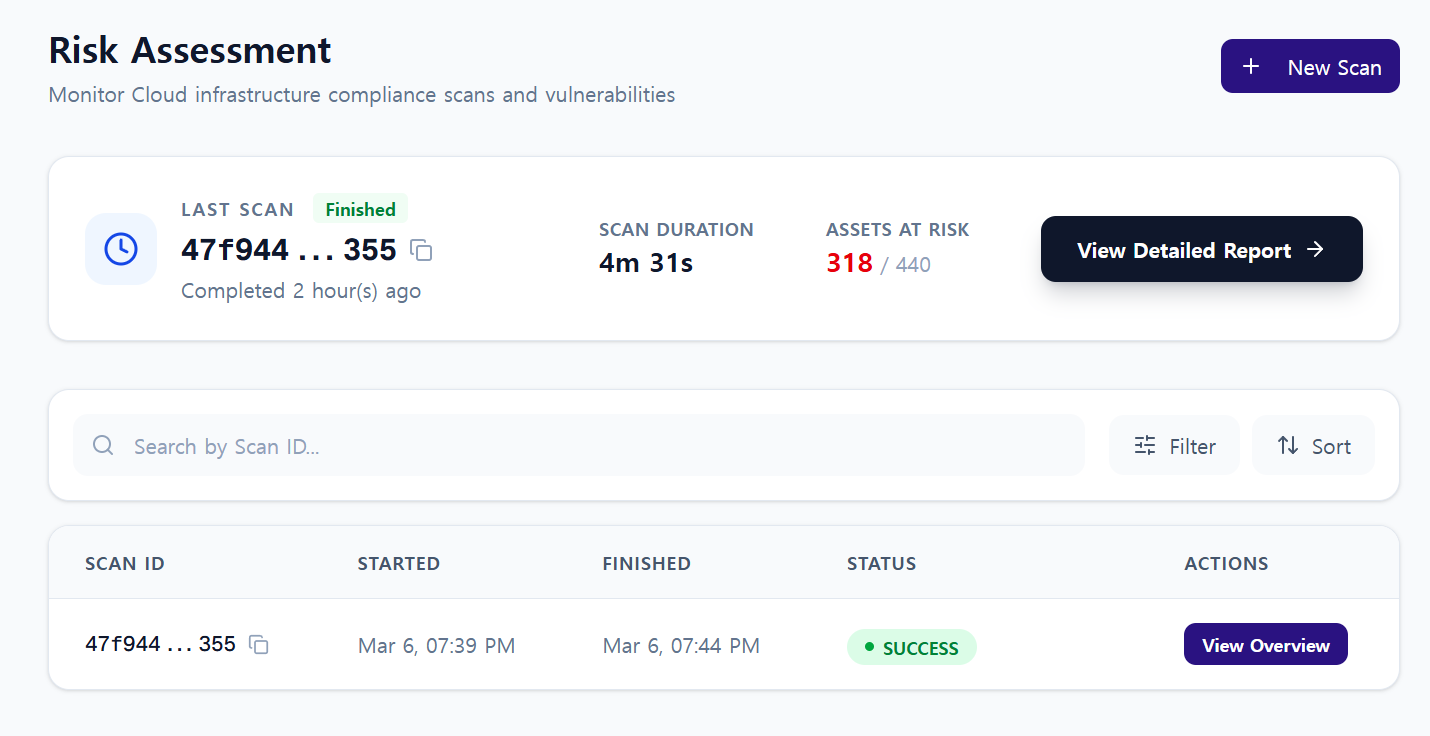
1.2. Latest Scan Summary Card
The top card shows you the results of the most recent scan at a glance.
- Scan ID
- Execution status (Finished / Success, etc.)
- Scan duration
- Number of assets at risk
- View Detailed Report button to navigate to the detailed results page
1.3. Scan History
Review results by Scan ID in the history table at the bottom.
- Started / Finished timestamps
- Status (success / failure)
- View Overview: See the risk distribution summary for that scan
2. Scan Results (Detailed Results)
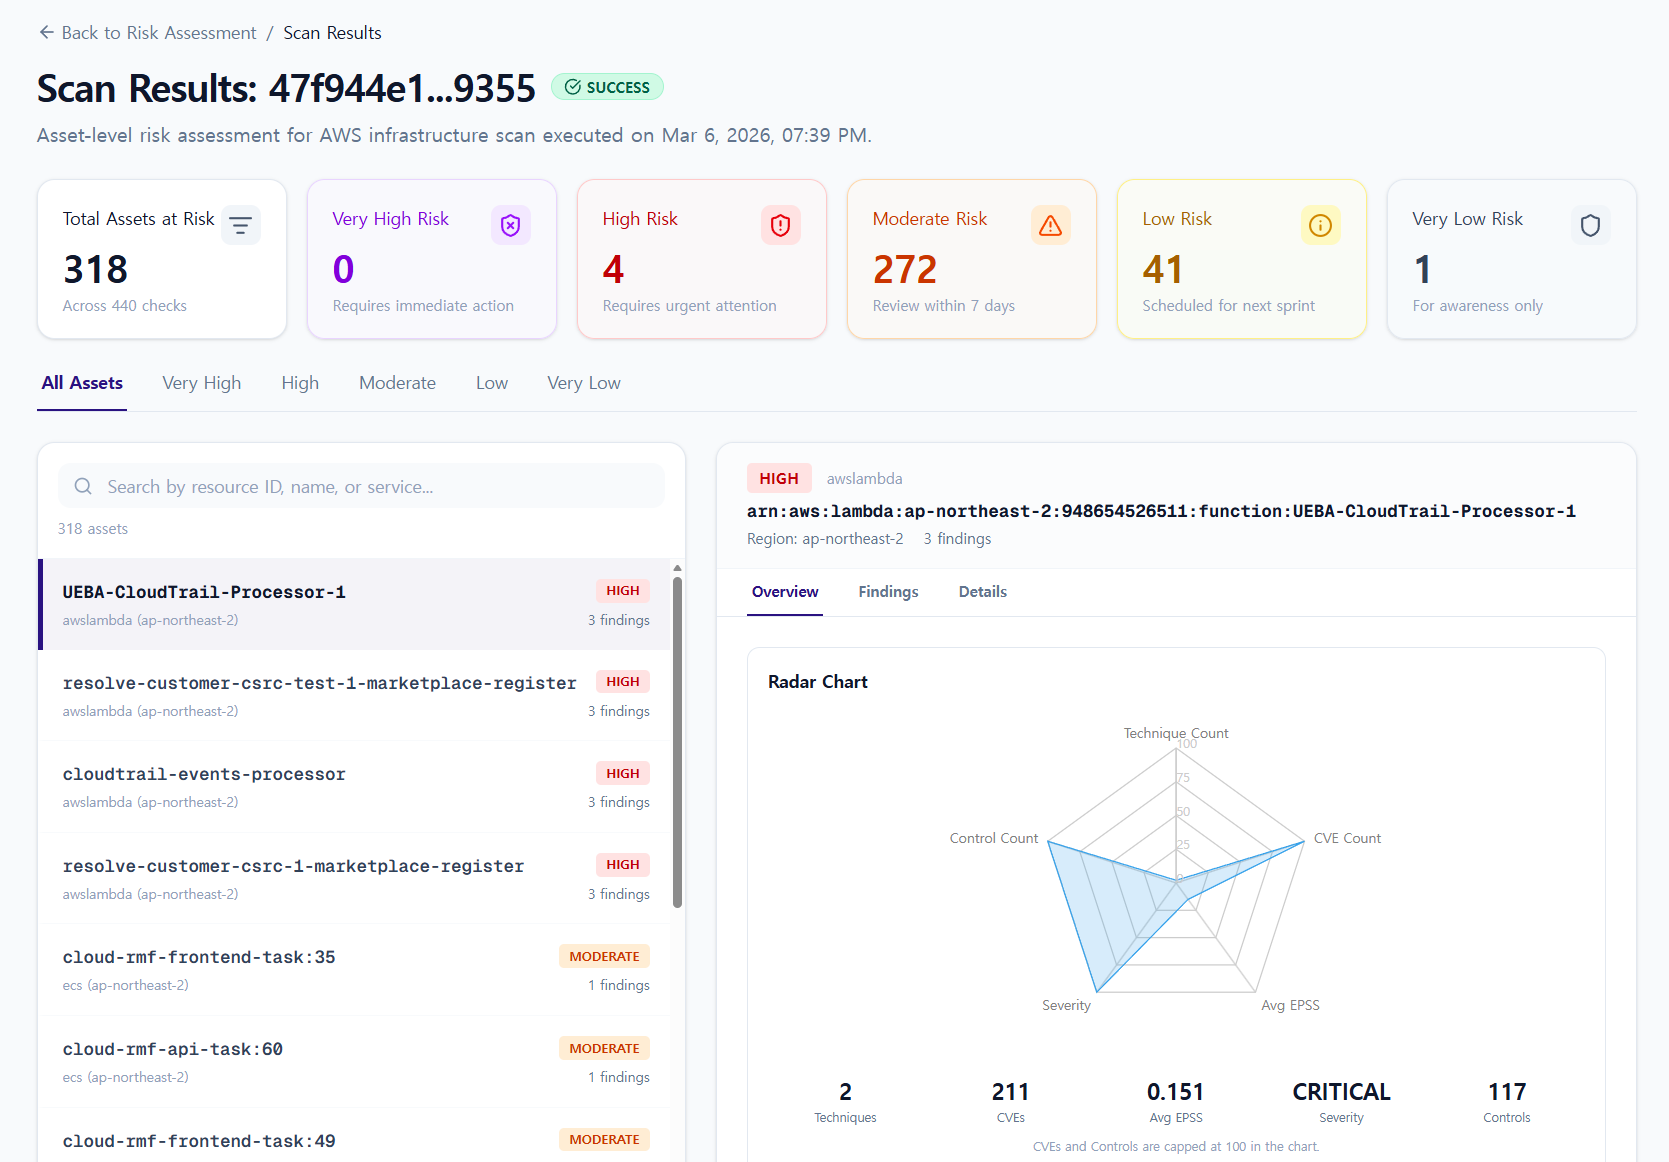
2.1. Top Risk Summary
The top of the scan results page shows the following metrics:
- Total Assets at Risk: Total number of assets evaluated as having risks
- Asset counts by risk level:
Very High,High,Moderate,Low,Very Low
Risk levels are calculated by combining an asset's vulnerabilities, attack likelihood, and potential impact.
- Very High – Critical security risk requiring immediate action
- High – Security issue with high attack potential
- Moderate – Potential security risk
- Low – Risk with limited impact
- Very Low – Low risk level
2.2. Asset List & Detail Panel
- Left side: List of at-risk assets (with search and risk level tab filters)
- Right side: Detailed results for the selected asset
- The right-side detail panel has three tabs: Overview / Findings / Details
3. Overview Tab
The Overview tab shows a summary of the risk assessment for the selected asset.
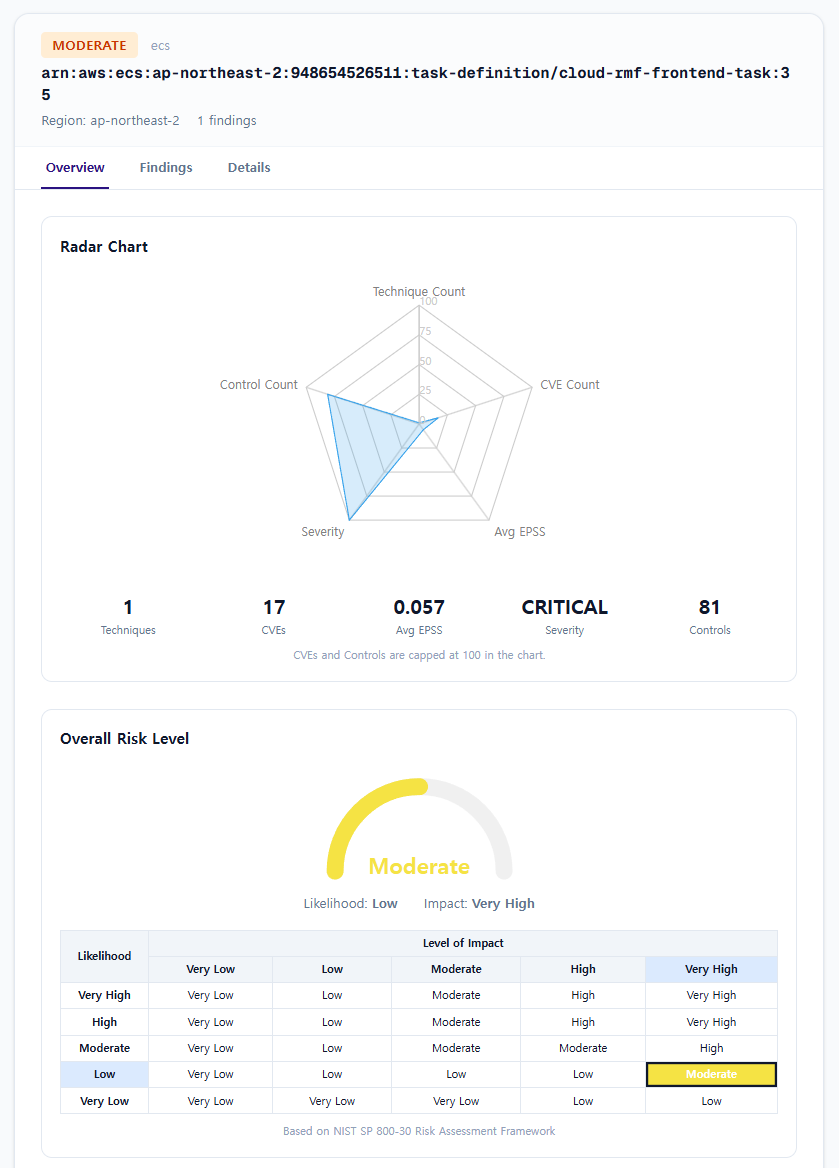
3.1. Radar Chart Metrics
The Radar Chart visualizes the key metrics used to calculate the Overall Risk Level.
- Techniques: Number of detected MITRE ATT&CK techniques
- CVEs: Number of CVEs found
- Avg EPSS: Average EPSS score of discovered CVEs
- Severity: Asset severity level
- Controls: Number of related security controls
3.2. Overall Risk Level
Overall Risk Level is calculated based on NIST SP 800-30.
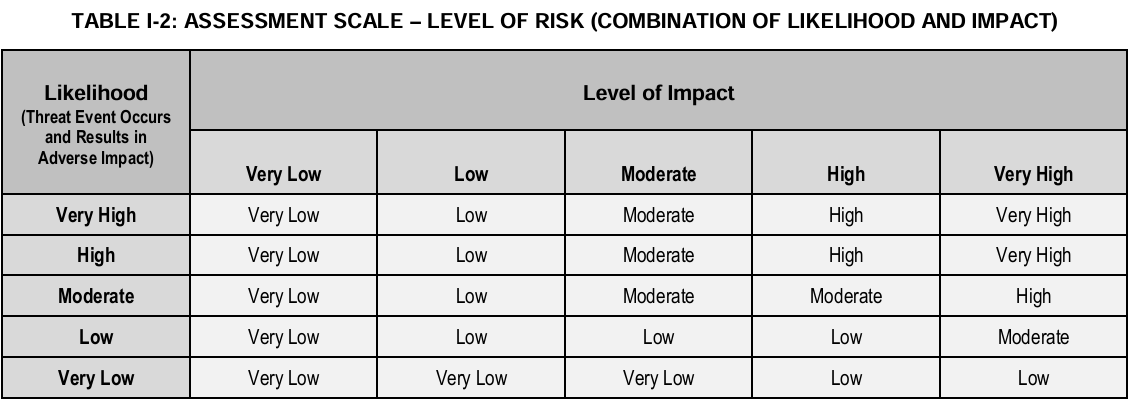
Risk = Likelihood × Impact- Likelihood: The probability of a risk occurring
- Impact: The impact if it does occur
4. Findings Tab
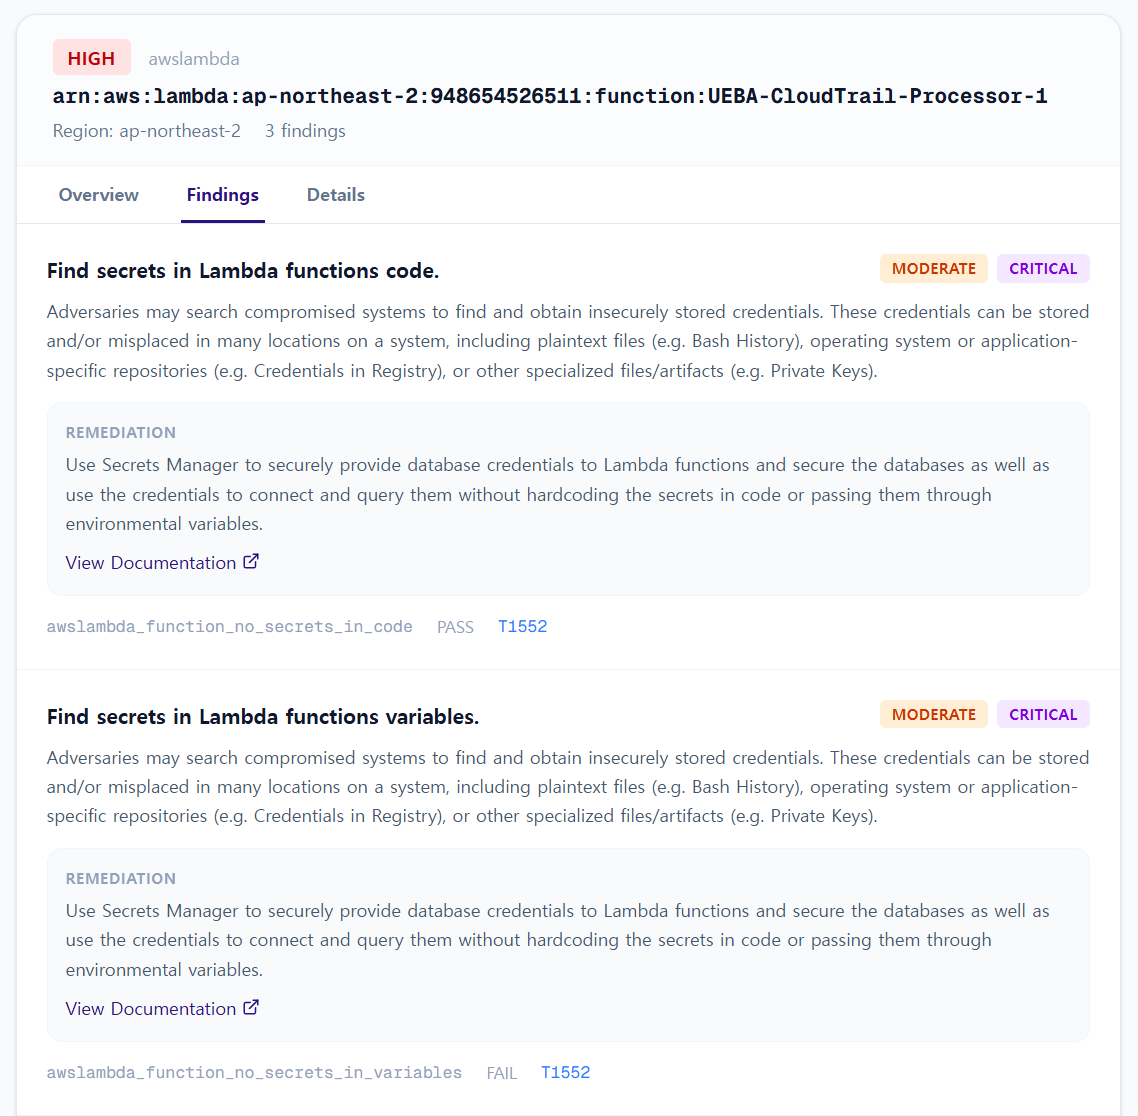
The Findings tab shows whether security checks applicable to the asset have passed or failed.
- PASS: Check passed
- FAIL: Check failed
- Click View Documentation on each item to see the corresponding remediation guide
5. Details Tab
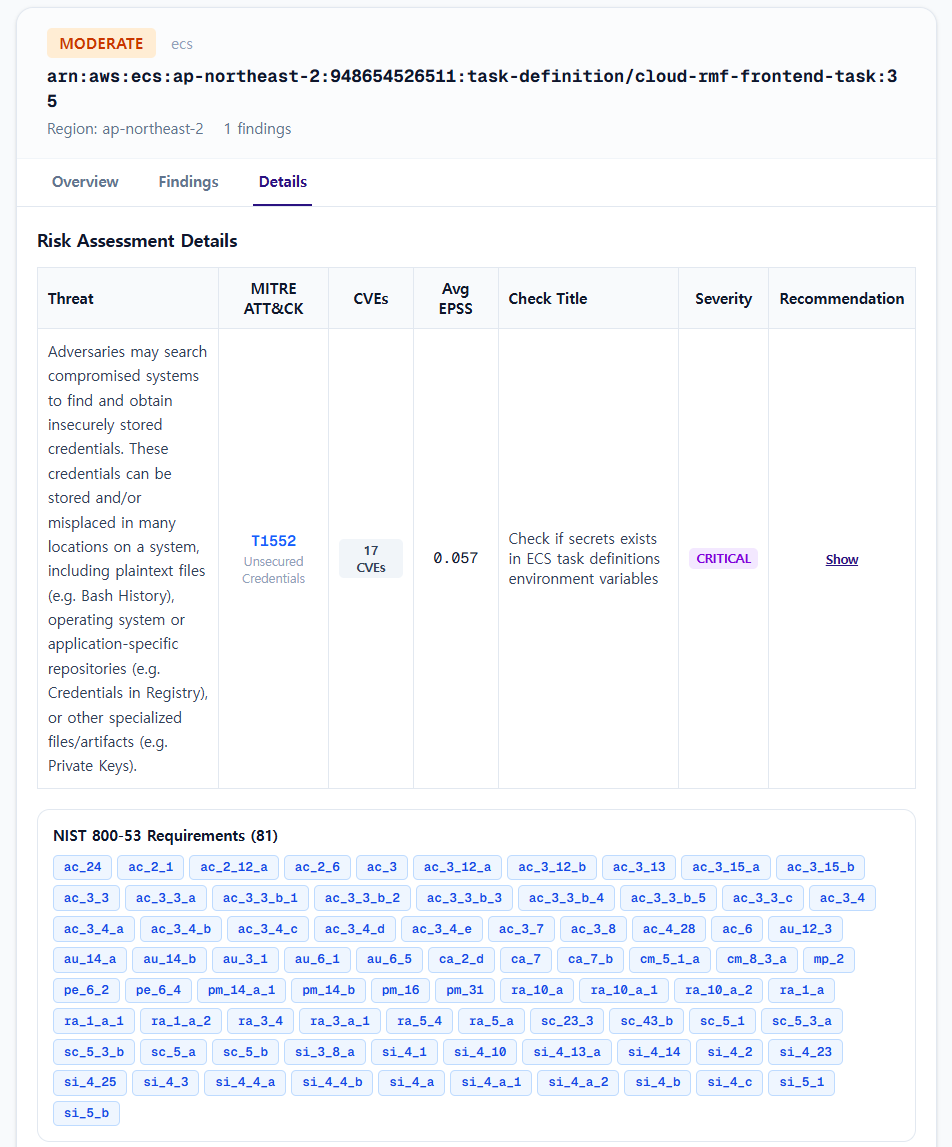
The Details tab presents risk items in a detailed table.
- Threat
- MITRE ATT&CK Technique
- CVEs
- Avg EPSS
- Check Title
- Severity
- Recommendation
NIST SP 800-53 Requirements are also displayed at the bottom of the page.
- These are the security control items that the asset is expected to comply with.
6. Operational Tips
- Run repeated scans against the latest synchronized assets to track risk trends over time
- Use Scan History to quickly compare status and results across scans
- Use the Overview to understand risk levels, then drill into Findings/Details for immediate root cause analysis and remediation